The Most Important Report in Real Estate?
Many people report on the National Association of Realtors’ (NAR) Existing Home Sales Report which quantifies the number of closed sales of single-family homes, townhomes, condominiums and co-ops. However, there is another report that NAR releases each month that may be even more important – the Pending Home Sales Report which reveals the current Pending Home Sales Index.
According to NAR, the Pending Home Sales Index (PHSI) is
“a leading indicator for the housing sector, based on pending sales of existing homes. A sale is listed as pending when the contract has been signed but the transaction has not closed, though the sale usually is finalized within one or two months of signing.”
The PHSI generally leads Existing Home Sales by a month or two and therefore is a more current pulse on home sales.
How is the PHSI calculated?
According to NAR:
“An index of 100 is equal to the average level of contract activity during 2001, which was the first year to be examined. By coincidence, the volume of existing-home sales in 2001 fell within the range of 5.0 to 5.5 million, which is considered normal for the current U.S. population”.
What does the PHSI look like right now?
The most recent report showed that the PHSI climbed 3.3 percent to 105.9 in July from 102.5 in June. The index is at its highest level since August 2013 (107.1) and is above 100 – considered an average level of contract activity – for the third consecutive month.
Looking at the PHSI at a regional level, we can see the comparative strength of each market.
 NORTHEAST
This region includes the states of Connecticut, Maine, Massachusetts, New Hampshire, New Jersey, New York, Pennsylvania, Rhode Island, and Vermont.
The PHSI in the Northeast jumped 6.2 percent to 89.2 in July, and is 8.3 percent above a year ago.
MIDWEST
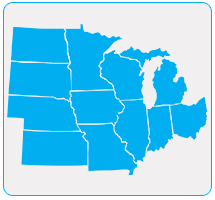
This region includes the states of Illinois, Indiana, Iowa, Kansas, Michigan, Minnesota, Missouri, Ohio, North Dakota, Nebraska, South Dakota, and Wisconsin.
The PHSI in the Midwest fell 0.4 percent to 104.6 in July, and is 6.4 percent below a year ago.
 SOUTH
SOUTH
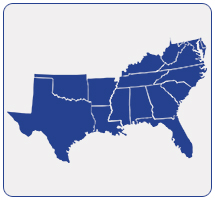
This region includes the states of Alabama, Arkansas, Delaware, Florida, Georgia, Kentucky, Louisiana, Maryland, Mississippi, North Carolina, Oklahoma, South Carolina, Tennessee, Texas, Virginia, and West Virginia.
The PHSI in the South increased 4.2 percent to 119.0 in July, and is 1.0 percent below a year ago.
WEST
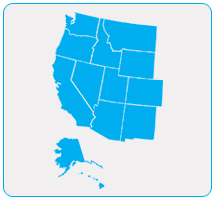
This region includes the states of Alaska, Arizona, California, Colorado, Hawaii, Idaho, Montana, Nevada, New Mexico, Oregon, Utah, Washington, and Wyoming.
The PHSI in the West increased 4.0 percent to 99.5 in July, and is 6.0 percent below a year ago.
Bottom Line
There can be an argument made that the Pending Home Sales Report is actually the most important report released each month because of its timeliness and its measurement of an historically healthy market.


